Sustainability & compliance tracker
Energy, water, waste and carbon KPIs against target per site, decarbonisation initiatives tracked through to completion, and a renewable energy asset pipeline - all blended into one ESG score per site, so drift shows up before it becomes a compliance problem.
Sites grouped by ESG score, a full metrics log against target, and reports built entirely from your own data.
Dashboard - portfolio-wide ESG performance at a glance
Sites - every site grouped by ESG score band, worst-first
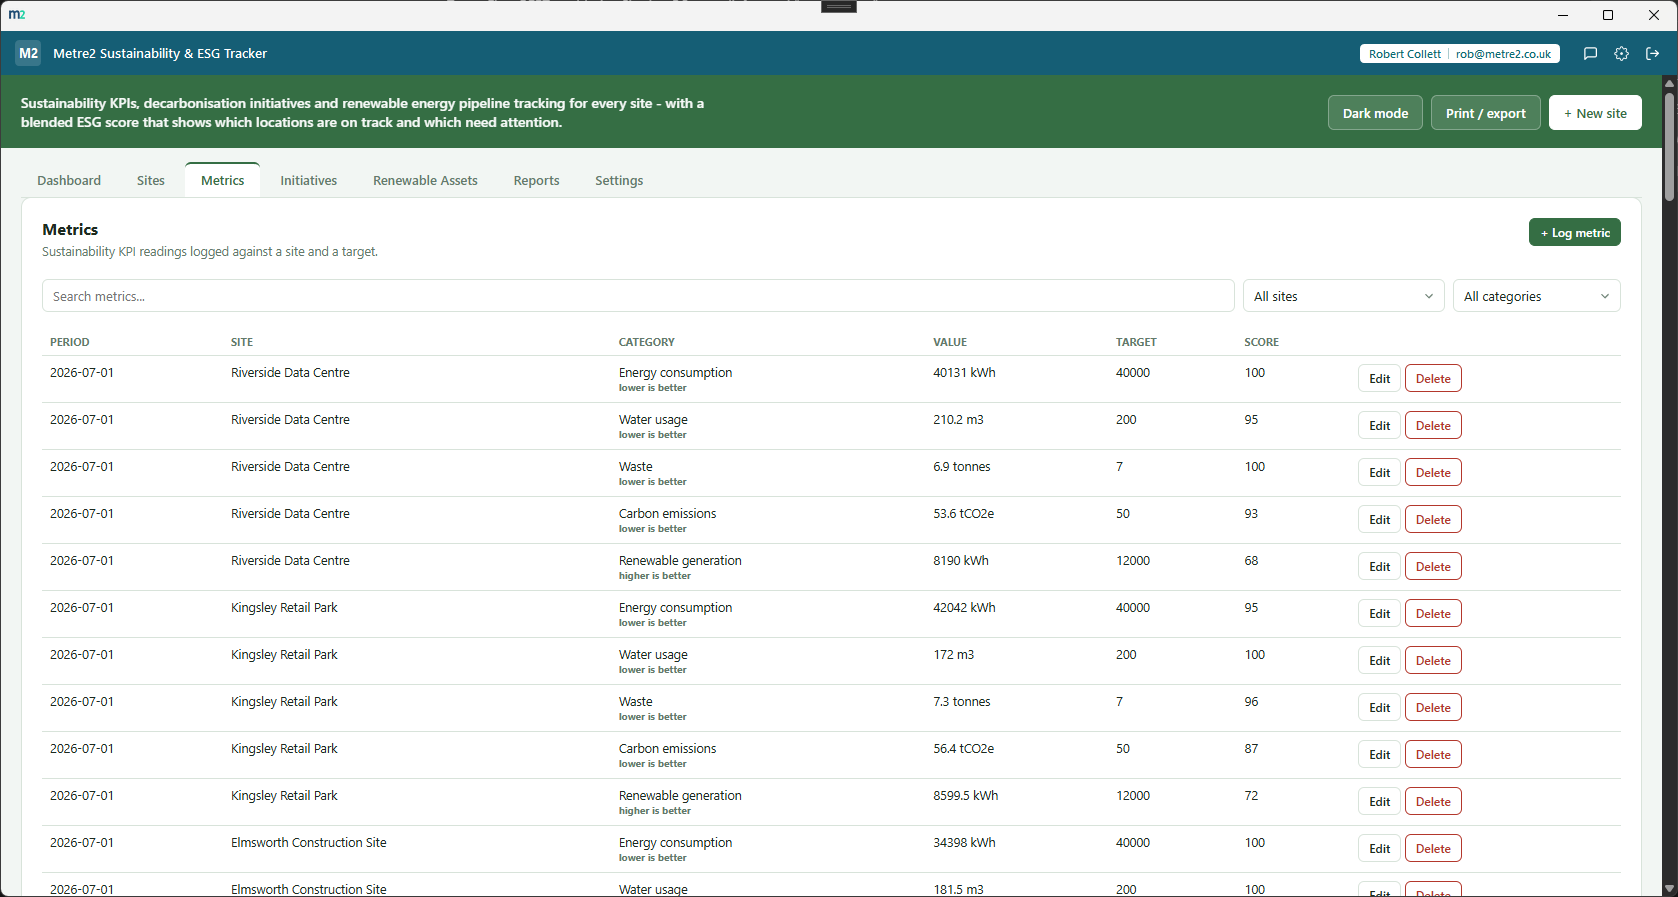
Metrics - every reading logged against its target, scored
Initiatives - decarbonisation work tracked to completion
Renewable Assets - the pipeline with expected vs actual yield
Reports - category performance, initiative status, ESG spread
Metric performance, initiative progress and renewable yield combine into a single 0-100 score and a Critical/At risk/Good/Excellent band - an early-warning signal, not just a spreadsheet of numbers.
Energy, water, waste and carbon measured against a reduction target, renewable generation measured against a generation target - log a reading each period and it's scored automatically.
Planned, in-progress, on-hold and complete - each initiative links to a site with a target and actual percentage, so a completed initiative that fell short still scores lower than one that hit its mark.
Solar, wind, battery storage and more, tracked from planned through under-construction to operational - each asset's expected versus actual yield feeds straight into its site's score once live.
Metrics, initiatives and renewable assets all roll up to the site they belong to, so a site's full sustainability picture - past readings, active work, live generation - is always one click away.
Category performance, an initiative status breakdown, an ESG score distribution and a renewable capacity mix by type - built entirely from your own local data, no cloud dashboard or monthly reporting fee.
Filter metrics, initiatives and assets by site, category, status or type, and search across the board - useful the moment more than a handful of sites are being tracked.
Export sites, metrics, initiatives or assets to CSV at any time. Light/dark theme and realistic sample data are included from the start, matching the rest of the Metre2 portfolio.
Watershed is a well-known carbon accounting and ESG reporting platform aimed at larger enterprises with dedicated sustainability teams. Here's how a focused, one-off desktop tracker compares for a business that just needs site-level KPIs, initiatives and a renewable pipeline tracked well.
| Feature | Sustainability & ESG Tracker | Watershed |
|---|---|---|
| Pricing model | One-off after a trial - no per-seat or per-tonne fee | Custom enterprise contracts, typically tens of thousands of dollars a year |
| Site-level KPI tracking against target (energy, water, waste, carbon) | ✓ | ✓ |
| Automated emissions-factor calculation engine | ✕ | ✓ |
| Decarbonisation initiative tracking, scored against target | ✓ | ~ |
| Renewable energy asset pipeline with yield tracking | ✓ | ✕ |
| Works fully offline, no account data leaves your machine | ✓ | ✕ |
| Formal audit-grade CSRD/SEC disclosure reporting | ✕ | ✓ |
| One account across a whole app portfolio | ✓ | ✕ |
Comparison based on Watershed's publicly discussed positioning as of August 2026 (watershedclimate.com, third-party reporting) - Watershed doesn't publish list pricing, contracts are custom, and pricing/features change over time, so check watershedclimate.com for current details. Watershed is a trademark of its respective owner; this comparison is for informational purposes and isn't sponsored by or affiliated with Watershed.
It's a Windows desktop app, submitted to the Microsoft Store for certification (2026-08-16) but not yet certified - a live Store listing will follow once certification completes.
It blends three signals: average metric performance against target (energy, water, waste and carbon reduction, plus renewable generation), average decarbonisation initiative progress, and renewable asset yield versus expected output. Each site gets one 0-100 score and a Critical/At risk/Good/Excellent band, so drift shows up before it becomes a compliance problem.
Five categories per site and reporting period: energy, water, waste and carbon (all measured against a reduction target - lower is better) and renewable generation (measured against a generation target - higher is better). Log a value each period and the app scores it against that site's target automatically.
Yes. Initiatives move through planned, in-progress, on-hold and complete, each linked to a site with a target and actual percentage. A completed initiative that fell short of its target scores lower than one that hit it - completion alone isn't the same as success.
A register of solar, wind, battery storage and other renewable assets per site, tracked from planned through under-construction to operational, each with an expected and actual yield once live - feeding into the same site score as everything else.
Yes - Sustainability & ESG Tracker uses the same shared Metre2 account as Vector, Forma and every other Keystone app. Sign in once and it works everywhere.