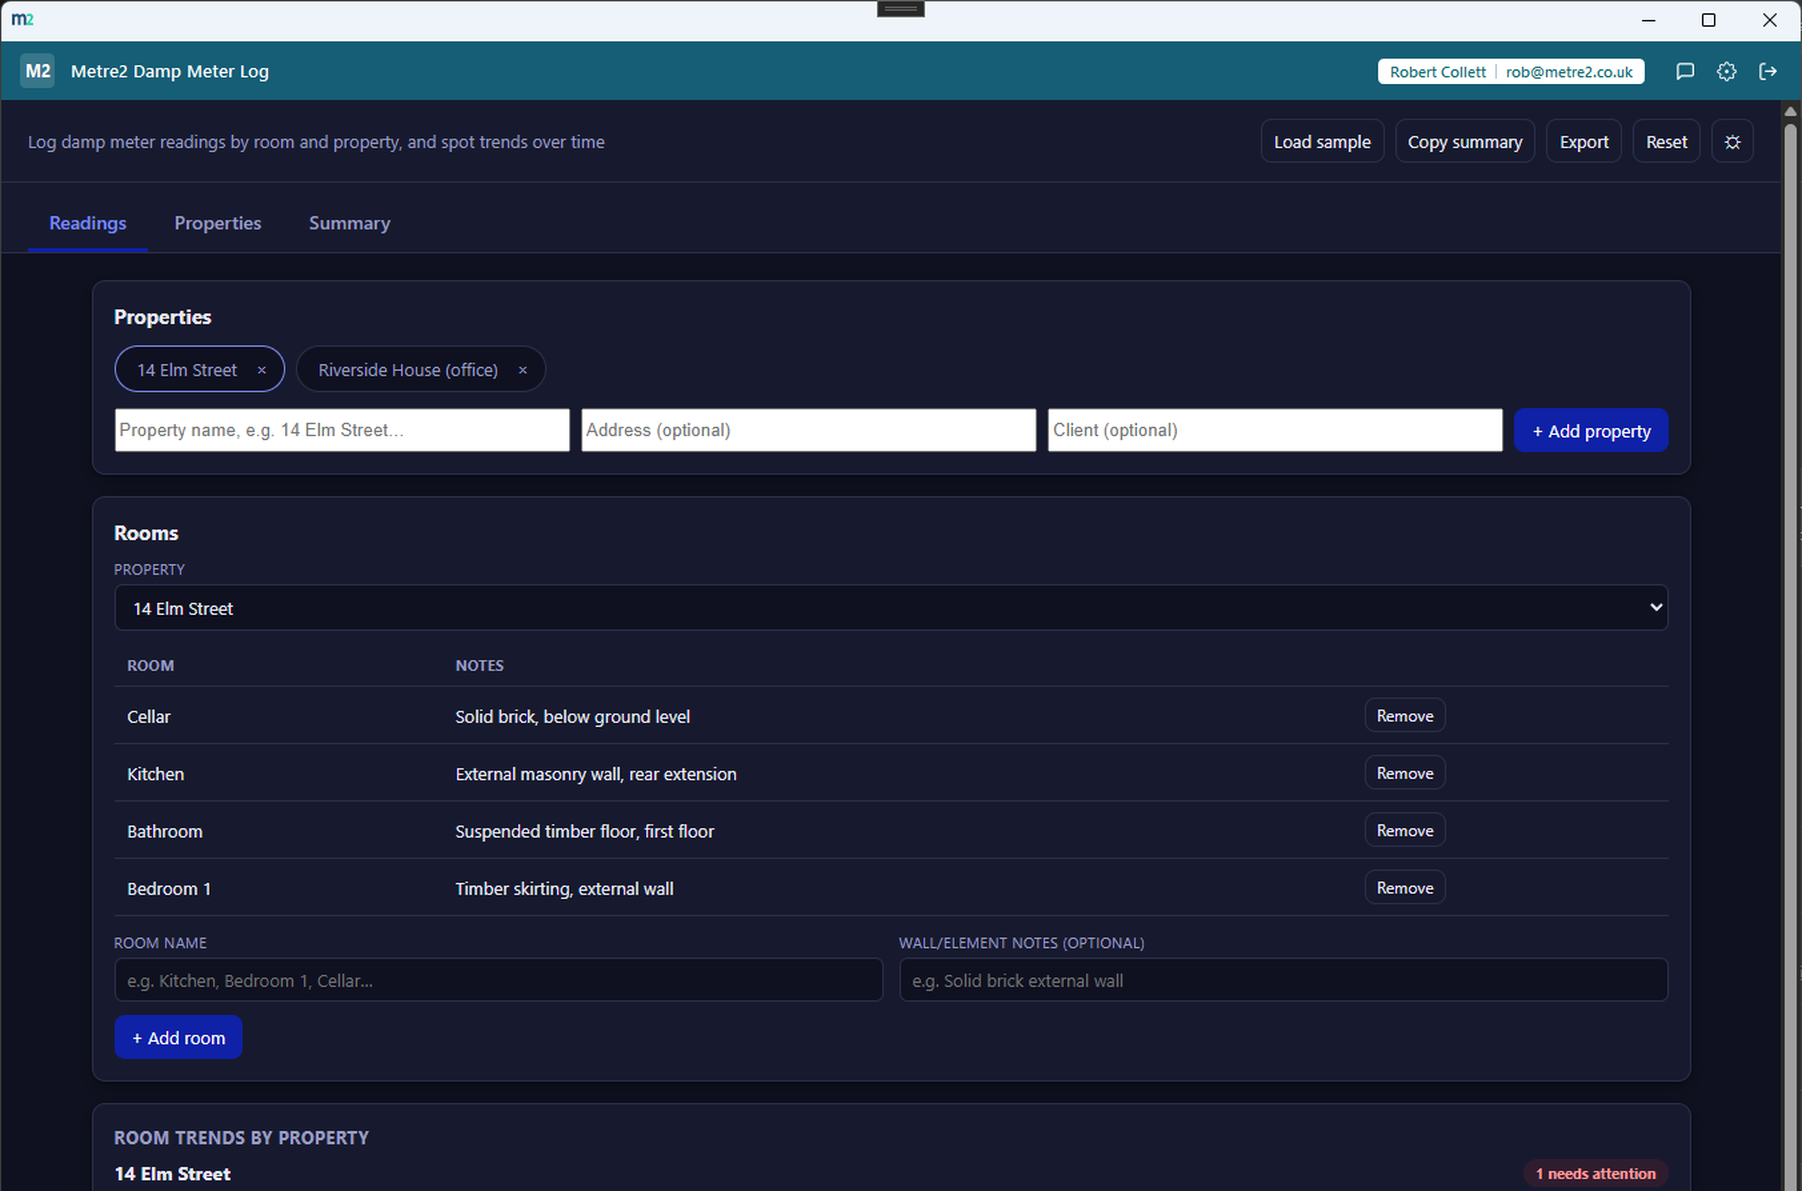
Log damp meter readings by room and property, and spot rising or falling trends over
time - a per-room trend chart with clear dry, at risk, damp and saturated status,
instead of only ever comparing today's number against memory.
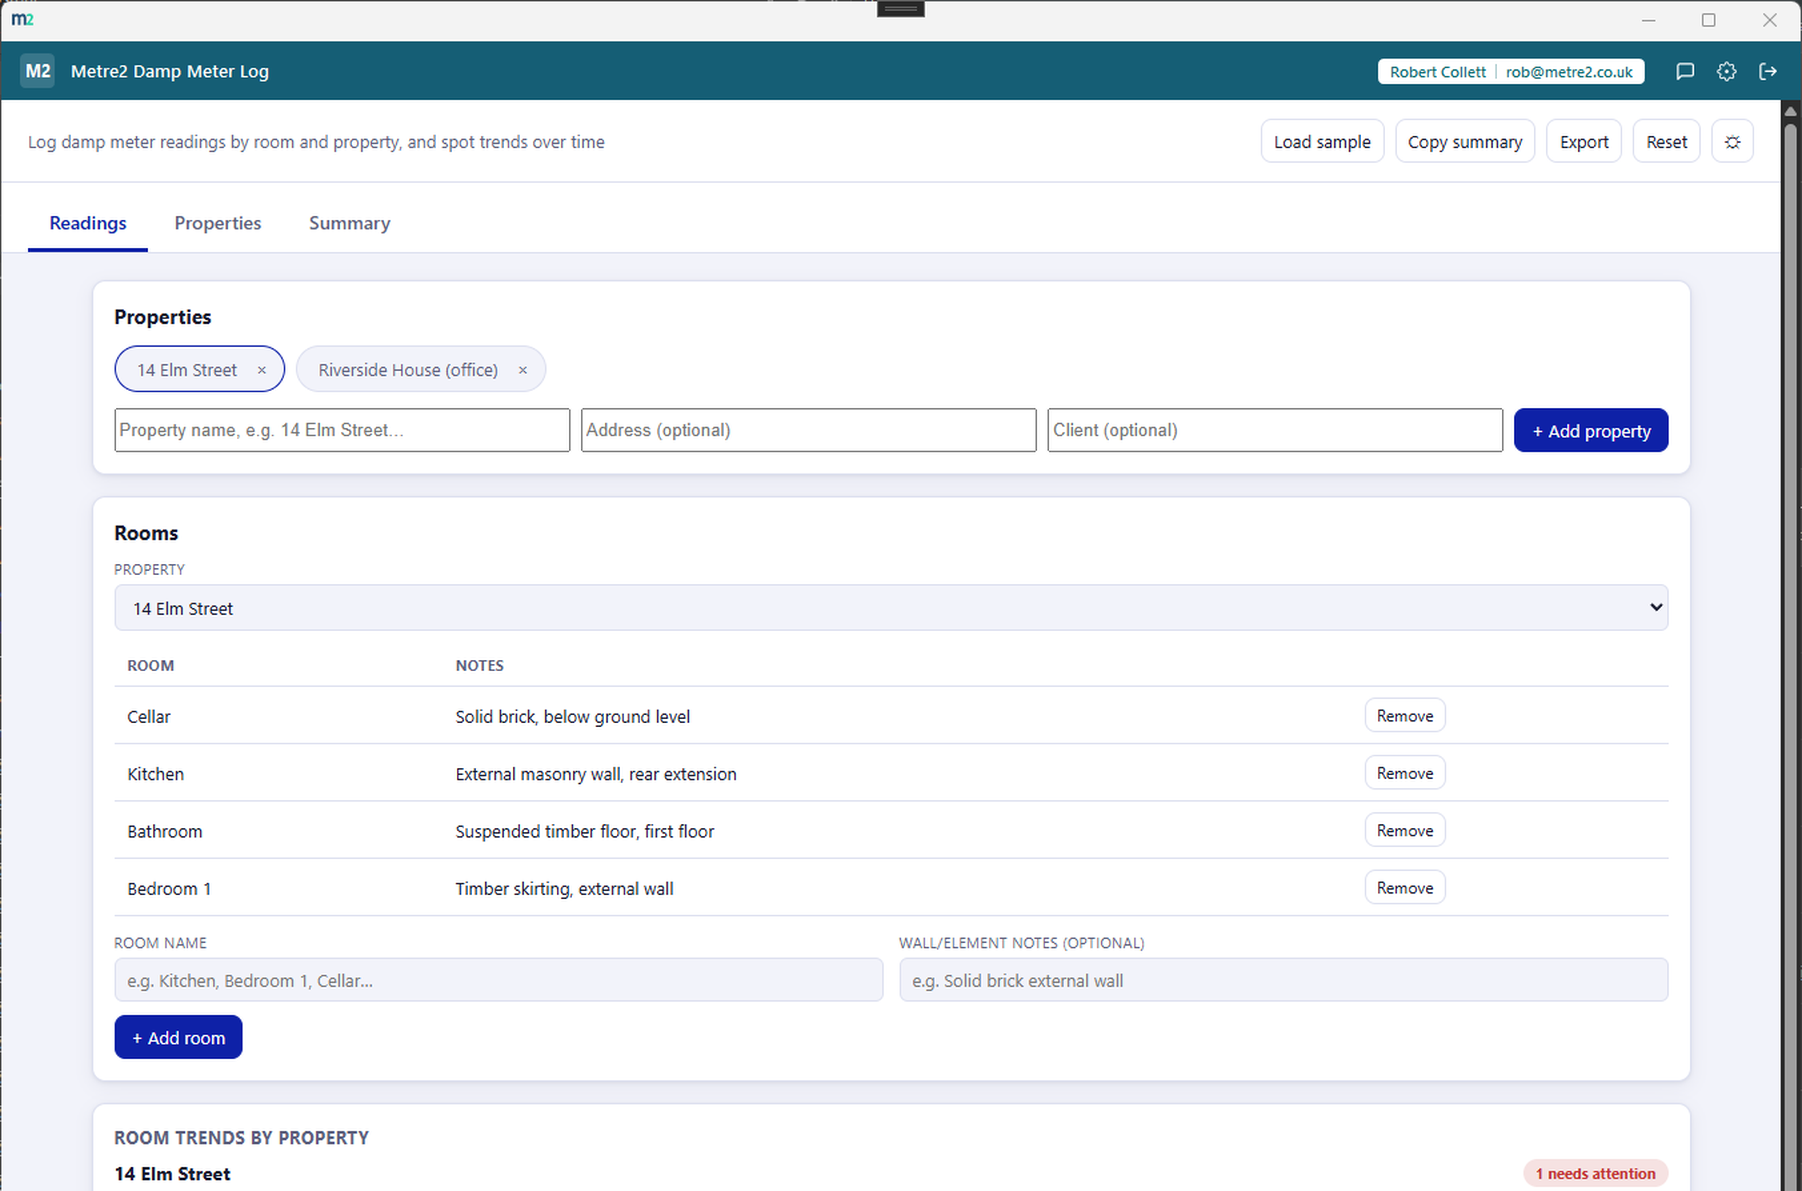
Every room gets its own miniature line chart plotting its full reading history
against a colour-banded dry-to-saturated scale, so a rising trend stands out at a
glance - not just today's single number.
Clear dry / at risk / damp / saturated status
Every reading is scored against illustrative, material-specific thresholds -
masonry/plaster and timber read differently - with a rising/falling/stable trend
arrow alongside the latest status.
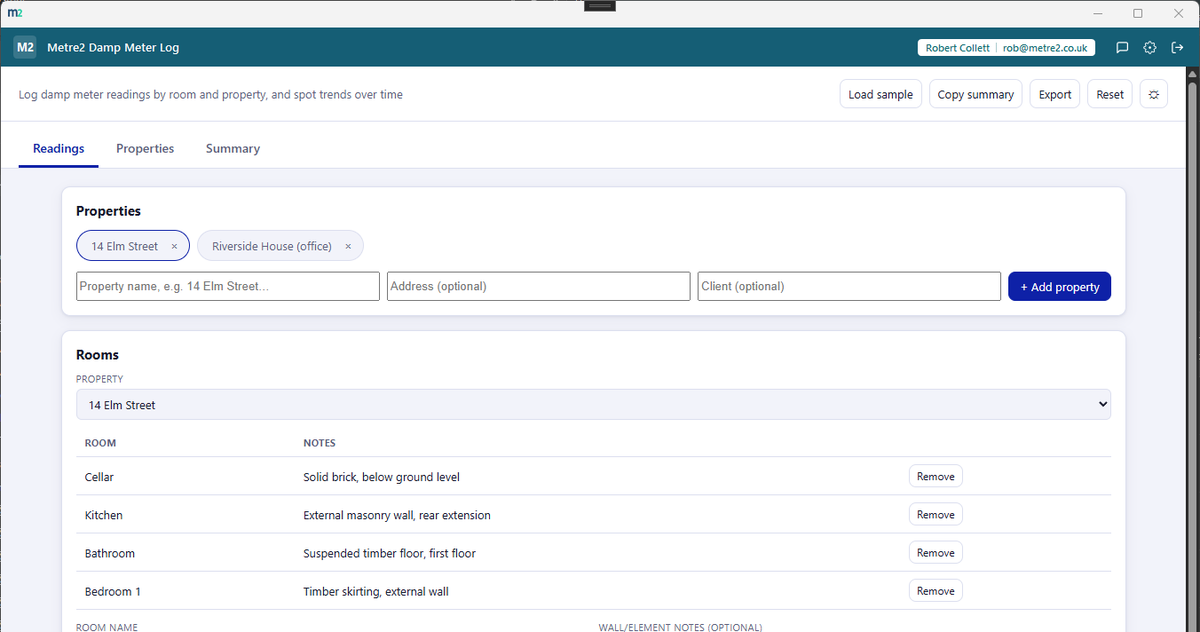
Any number of properties and rooms
Add as many properties as your work needs, each with independently tracked rooms -
kitchen, cellar, bedroom, whatever the survey calls for - with optional wall/element
notes.
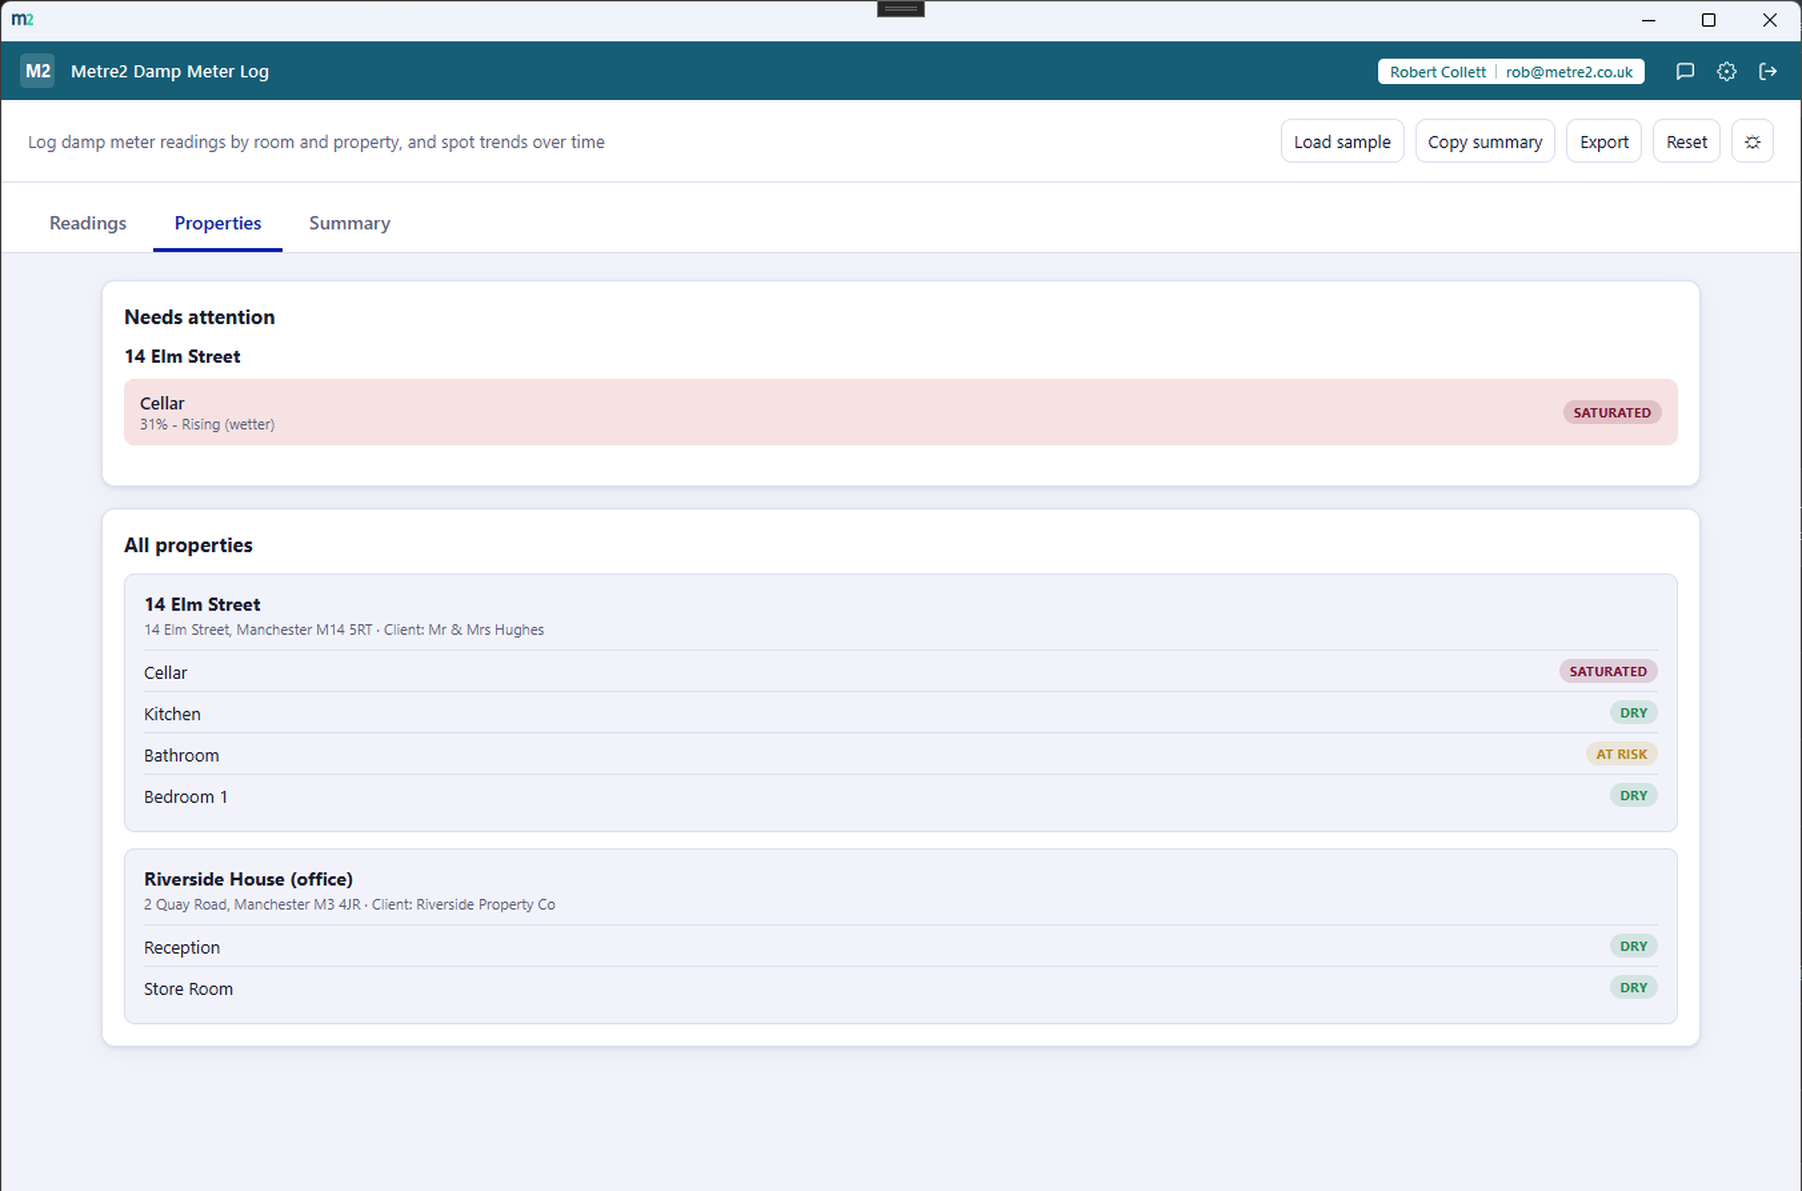
Needs-attention view, grouped by property
A dedicated Properties tab flags every room currently reading damp or saturated,
grouped by property, so nothing gets missed on a return visit.
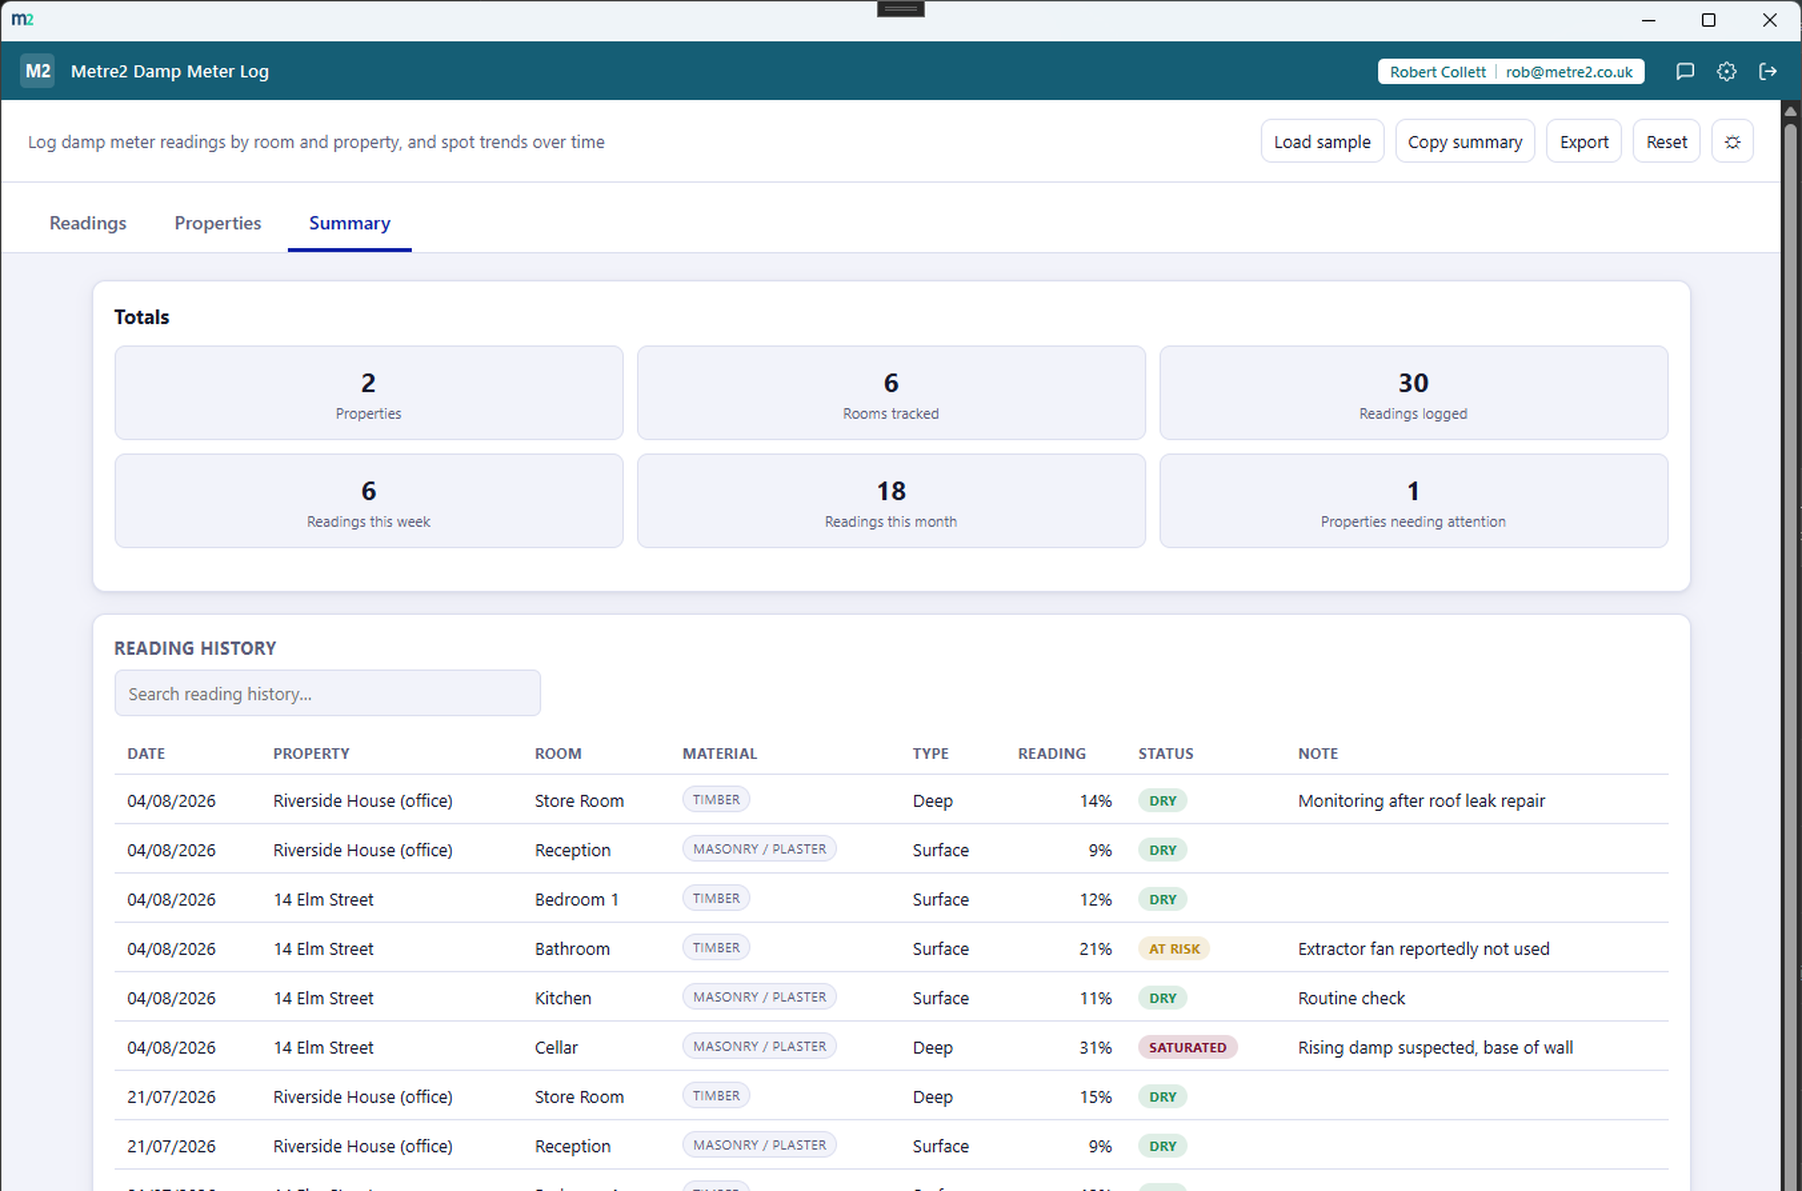
Material and reading-type context
Every reading carries a material (masonry/plaster or timber) and a reading type
(surface or deep), because a damp meter reads differently depending on both.
Totals and full history
The Summary tab totals properties, rooms and readings logged - including this week
and this month - and holds a full searchable reading history.
Copy summary or export HTML
Copy a plain-text summary of totals and everything currently flagged damp or
saturated to the clipboard, or export a standalone HTML file to keep or share.
Light/dark theme and sample surveys
Light/dark theme remembers your choice, and two rotating sample surveys - a Victorian
terrace resurvey and a new-build snagging survey - let you explore the app before
entering your own readings.
How it compares to PocketSurvey
PocketSurvey is a well-known UK building-surveying platform used for a wide range of
professional inspection reports, including damp and mould modules. It's built for
surveyors producing formal client reports across many inspection types - here's how a
focused, one-off desktop tool for damp meter readings compares.
Feature
Damp Meter Log
PocketSurvey
Pricing model
£4.99 one-off after trial
Subscription licence, quote-based per surveyor
Built specifically for damp trend tracking
✓
~
Per-room trend chart across repeat visits
✓
~
Formal RICS-style survey report generation
✕
✓
Multi-surveyor/team accounts
✕
✓
Works fully offline
✓
✓
Native tablet/mobile field app
✕
✓
One account across a whole app portfolio
✓
✕
Comparison based on PocketSurvey's publicly listed features as of August 2026
(pocketsurvey.org, pocketsurvey.com) - pricing and features change over time, so check
pocketsurvey.org for current details. PocketSurvey is a trademark of its respective
owner; this comparison is for informational purposes and isn't sponsored by or
affiliated with PocketSurvey.
Damp Meter Log, in practice
Frequently asked questions
Do I need to install anything to use Damp Meter Log?
Yes - Damp Meter Log runs as a Windows desktop app, and you can try it for free from the Microsoft Store.
Does my Damp Meter Log account work with Vector and Forma?
Damp Meter Log shares its sign-in with every other Keystone app, Vector and Forma included - there's no separate account to set up.
How does the app decide a reading's severity?
Each reading is scored dry, at risk, damp or saturated against illustrative percentage thresholds for the material you select (masonry/plaster or timber). These are indicative guidance, not a certified diagnostic damp survey - meter calibration, material composition, humidity and construction age all affect real readings.
How does the trend chart work?
Every room gets its own miniature line chart plotting its full reading history against a colour-banded severity scale, with a trend arrow showing whether the room is rising (getting wetter), falling (drying out) or holding steady.
Can I track more than one property?
Yes - add as many properties as you need, each with its own independently tracked rooms and reading history.
How do I see what needs attention?
The Properties tab flags every property with a room currently reading damp or saturated, grouped by property, so nothing gets missed on a return visit.
Can I export or share my log?
Yes - copy a plain-text summary to your clipboard, or export a standalone HTML file with totals and everything currently flagged damp or saturated.