Projects, tasks and risk - in one place, on your device
Track projects and their tasks, then run a proper risk register alongside them - every risk scored by likelihood and impact and plotted live onto a 5x5 risk matrix heatmap on the Dashboard. No sign-up, no cloud sync, no subscription creep - everything stays on this device.

Every risk's likelihood x impact score lands it in one of 25 cells, coloured Low, Medium, High or Critical - the whole portfolio's risk exposure at a glance, right on the Dashboard.
Every project tracks status, client, owner, dates and budget, with a progress bar computed automatically from the percentage of its tasks marked Done - no manual updating required.
Every task belongs to a project, with an assignee, due date, priority and status - overdue tasks are highlighted automatically, sorted soonest-first.
Every risk records a category, owner and mitigation plan alongside its likelihood and impact, with an Open / Mitigating / Closed status you control.
Both the Tasks and Risk Register tabs filter by project, plus status for tasks and status/category for risks - focus on exactly what a project needs, instantly.
Risks sort by score, descending, so your biggest exposure is always at the top of the register - no manual re-ranking as new risks come in.
Every project, task and risk is stored only in this device's local storage - no account, no cloud sync, no network call anywhere in the app.
Switch between a light or dark theme that remembers your choice, and a Settings tab with a single, explicit "Reset all data" action behind a confirmation.
Most small teams either bolt a risk register onto a spreadsheet, or use a general-purpose project tool that treats risk as an afterthought. Here's how a dedicated projects-plus-risk app compares.
| Feature | Project Manager | A spreadsheet risk register | A general project tool |
|---|---|---|---|
| Live 5x5 risk matrix heatmap | ✓ Built in, computed automatically | ✕ Manual formulas and conditional formatting | ✕ Usually not offered at all |
| Project data ever leaves your device | ✓ Never | Depends where the file is stored | ✕ Cloud-hosted by design |
| Project progress computed from tasks | ✓ Automatic | ✕ Manually updated | ✓ (in most tools) |
| Monthly subscription required | ✓ No | ✓ No | ✕ Usually per-seat, per-month |
| Set-up time | ✓ None - open and use | ✕ Build the formulas yourself | ✕ Configure boards, fields, workflows |
General comparison as of August 2026. Not affiliated with any spreadsheet application or project management vendor.
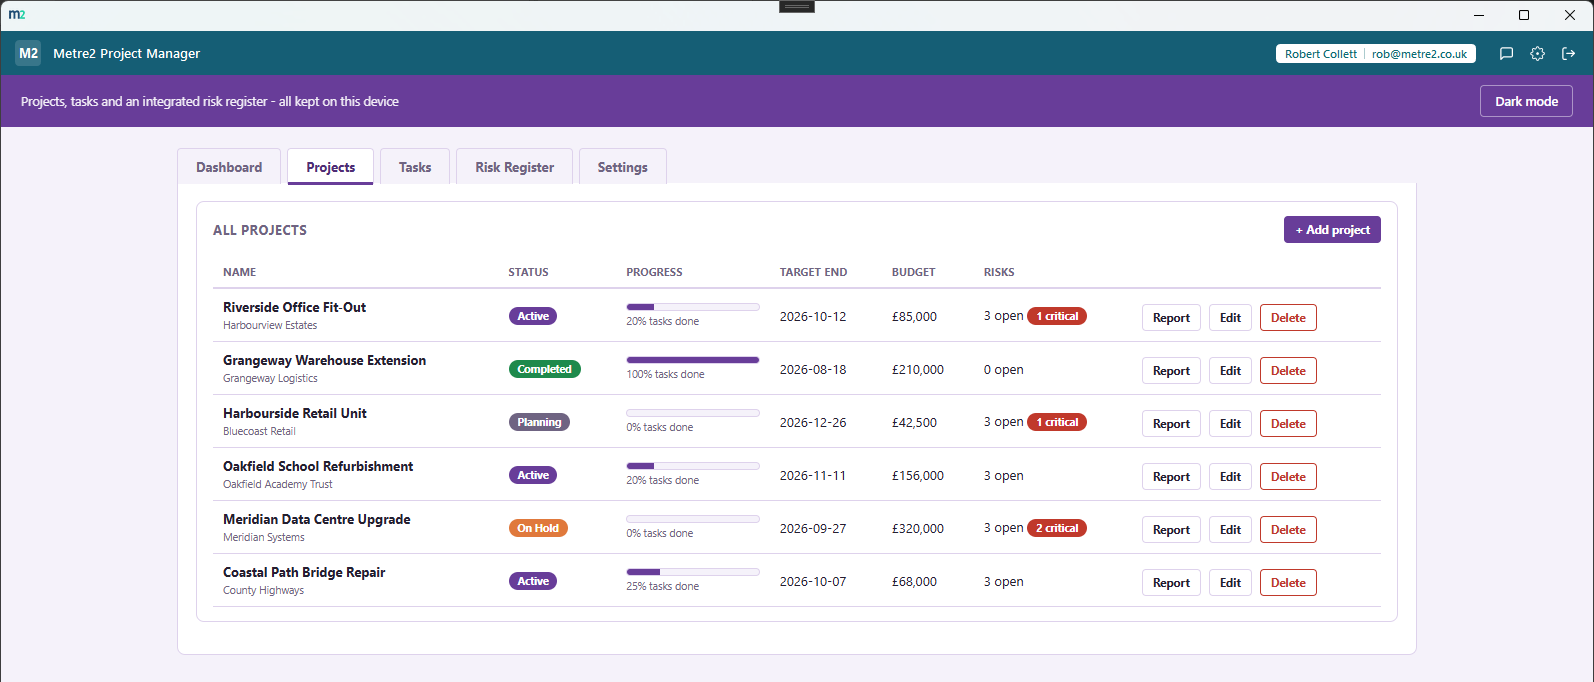
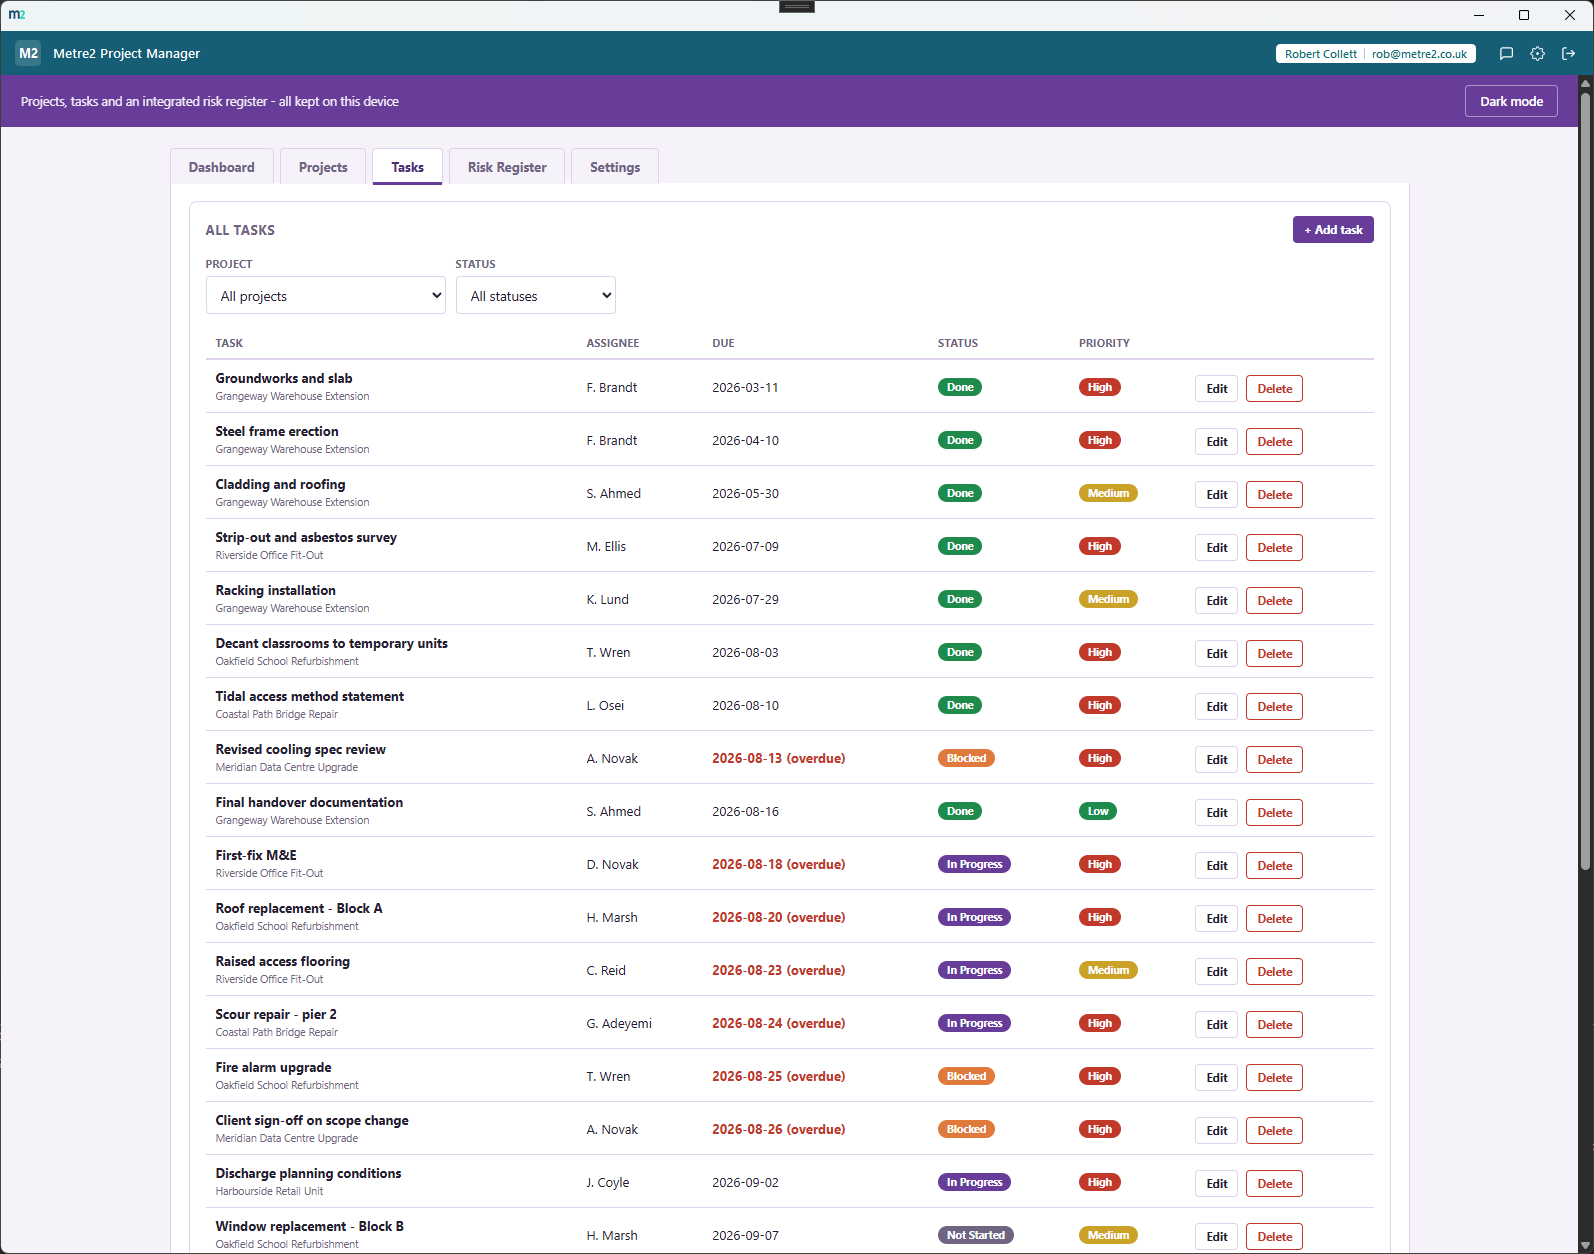
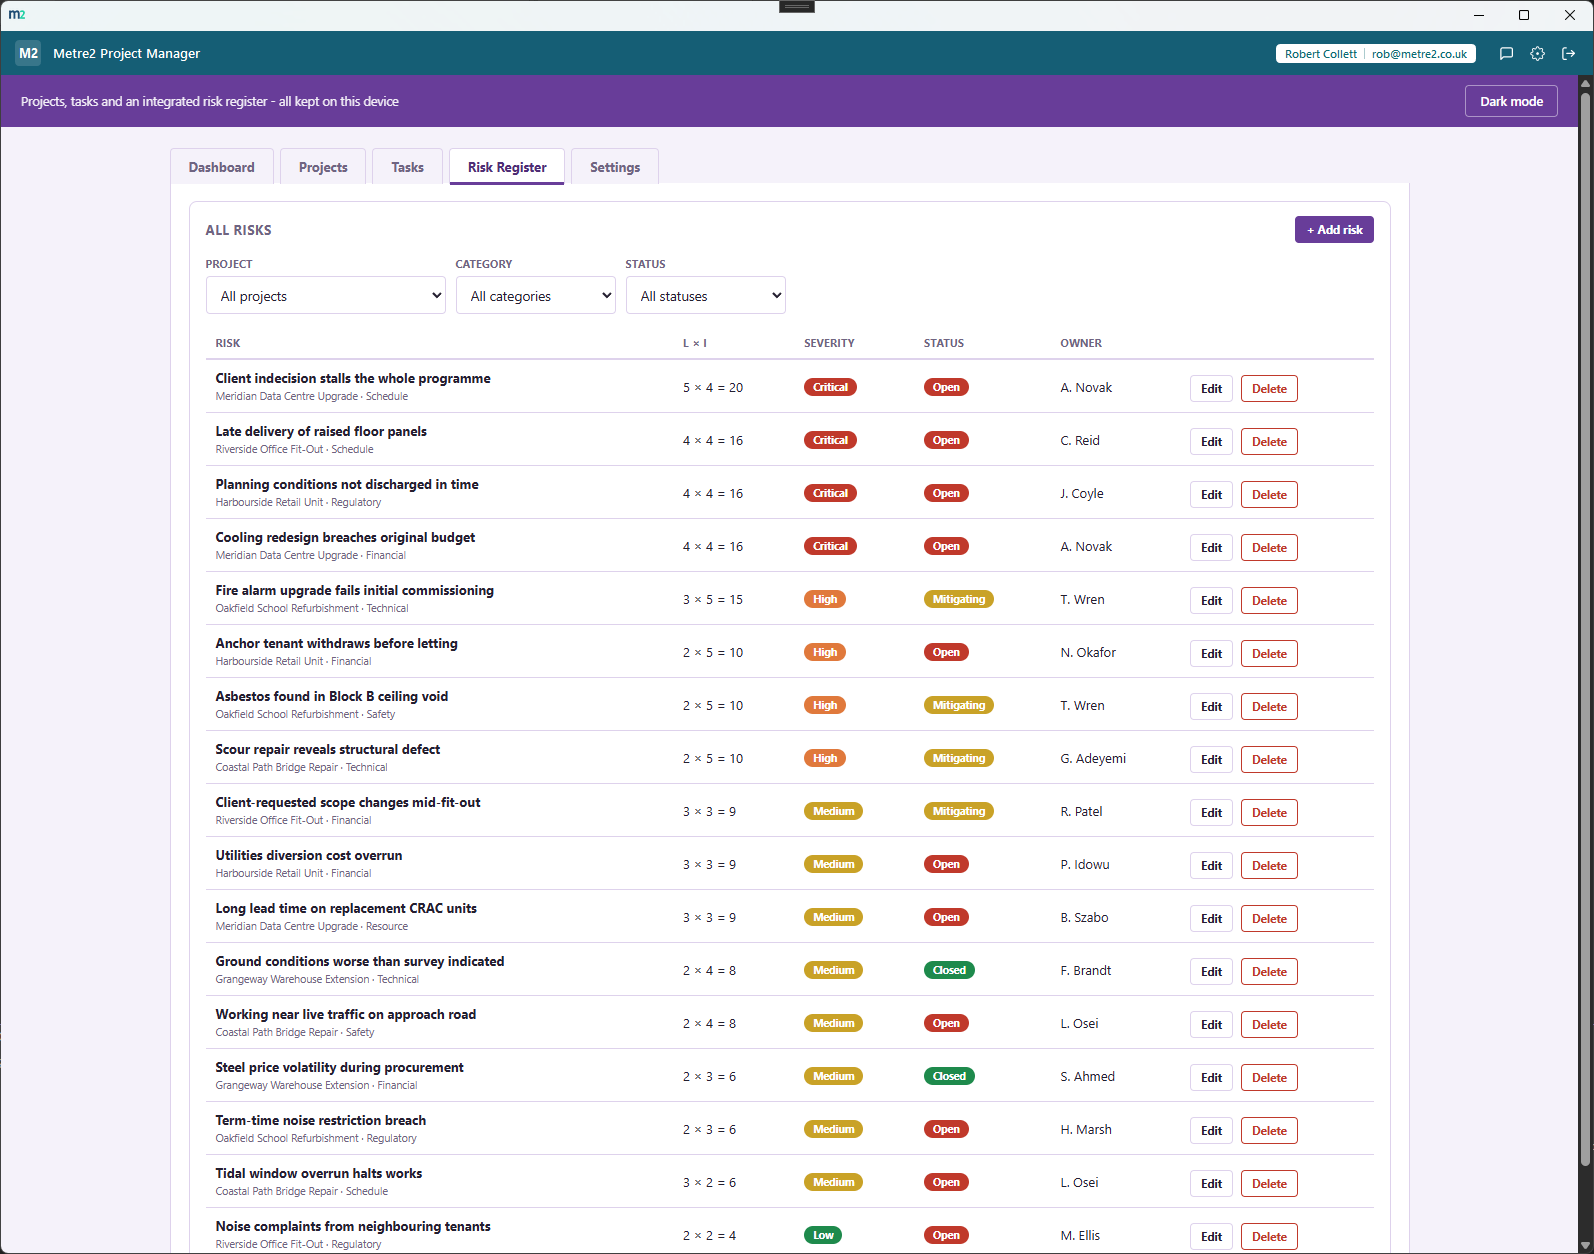
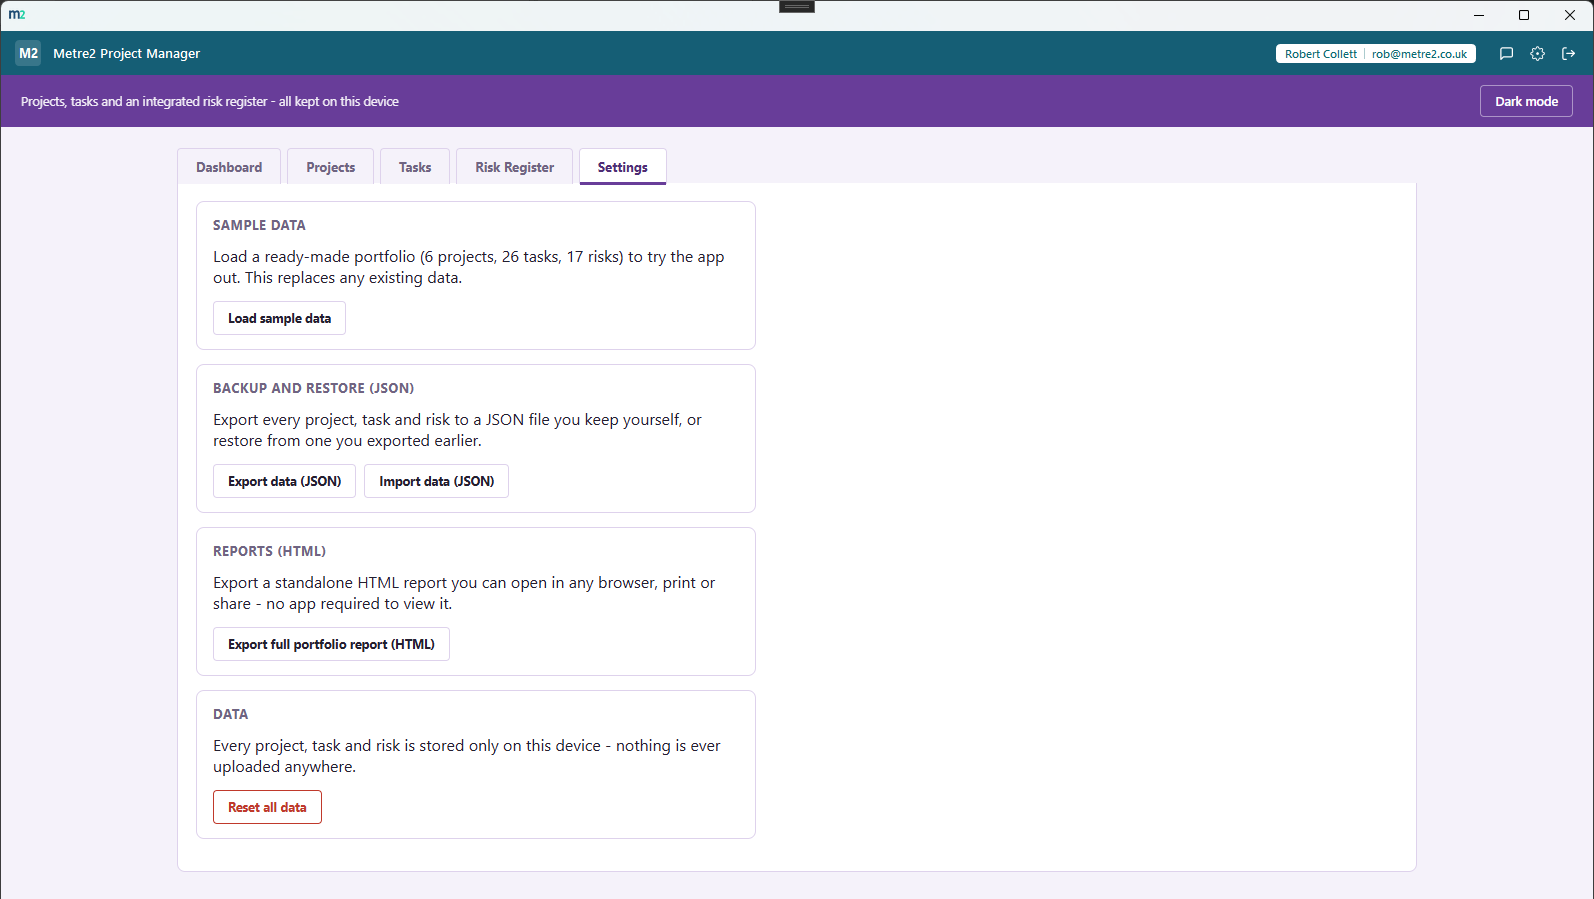
Every risk gets a likelihood and impact score (1-5 each), which automatically computes a severity band - Low, Medium, High or Critical - and plots onto a live 5x5 risk matrix heatmap on the Dashboard. That's the same maths a spreadsheet-based risk register does, but computed and visualised for you instantly, with no formulas to maintain.
No. Every project, task and risk is stored only on this device via local storage - there is no account to create, no cloud sync, and no network call anywhere in the app.
Yes. Every task belongs to a project, has a due date, status, priority and assignee, and each project's progress bar is computed automatically from the percentage of its tasks marked Done.
Each risk's score is likelihood x impact (1 to 25). Scores of 1-4 are Low, 5-9 Medium, 10-15 High, and 16-25 Critical. The Dashboard's matrix shows every combination of likelihood and impact as a coloured cell with a live count of risks landing in it, so you can spot your worst exposure at a glance.
Yes. Both the Tasks and Risk Register tabs have a project filter, plus a status filter for tasks and status/category filters for risks, so you can focus on exactly what you need.
No - Project Manager is free in the Microsoft Store, with no account and no sign-in.