How-to guide
A hydrant flow test gives three numbers: the static pressure, the residual pressure and the flow at the residual. Plotted on N^1.85 graph paper, where the flow axis is scaled to flow to the power 1.85, the supply is a straight line between them, and the sprinkler demand plus hose allowance can be read against it. Metre2 Sprinkler Design draws the graph for you, with the backflow preventer and alarm valve losses and the elevation taken off, and shows the margin you have left.
Open your project or the Office floor (sample) on the Start screen. The supply connection is the node where the underground meets the city main.
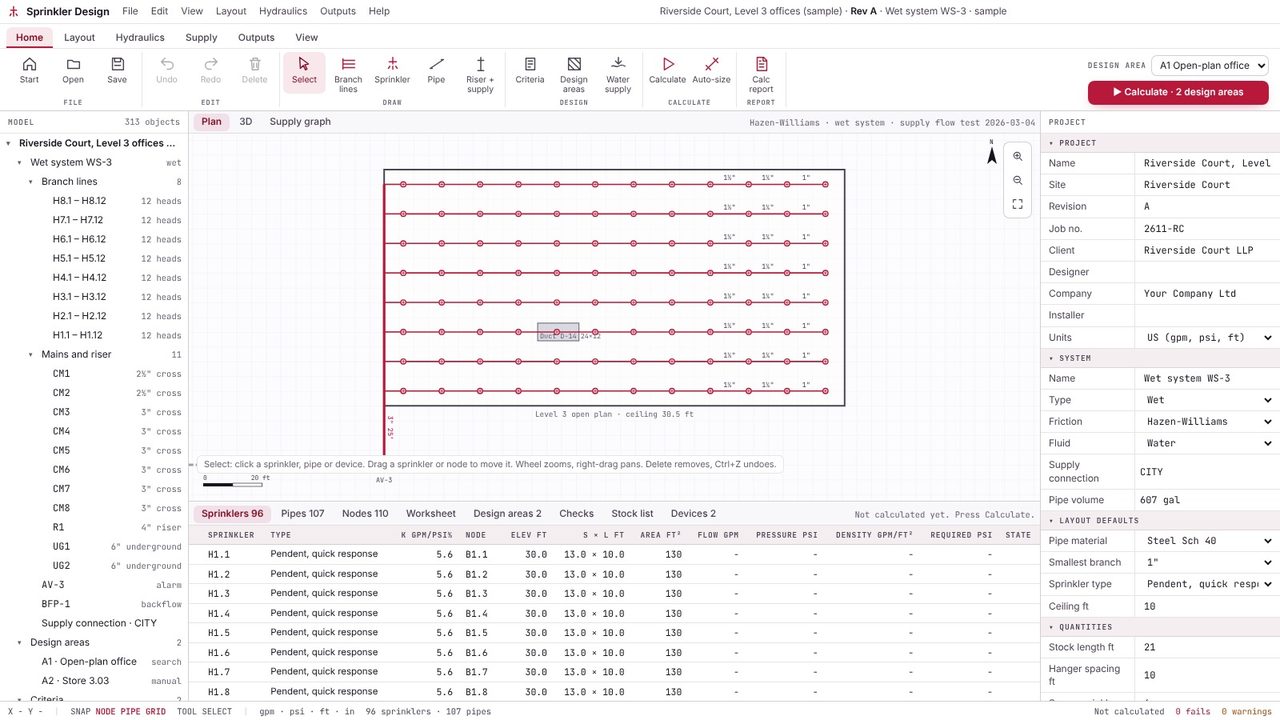
On the Supply tab, open Water supply and type the static pressure, the residual pressure, the flow at the residual, the gauge elevation, the test date and where it was taken. An old test or a gauge at a different level from the site is flagged.
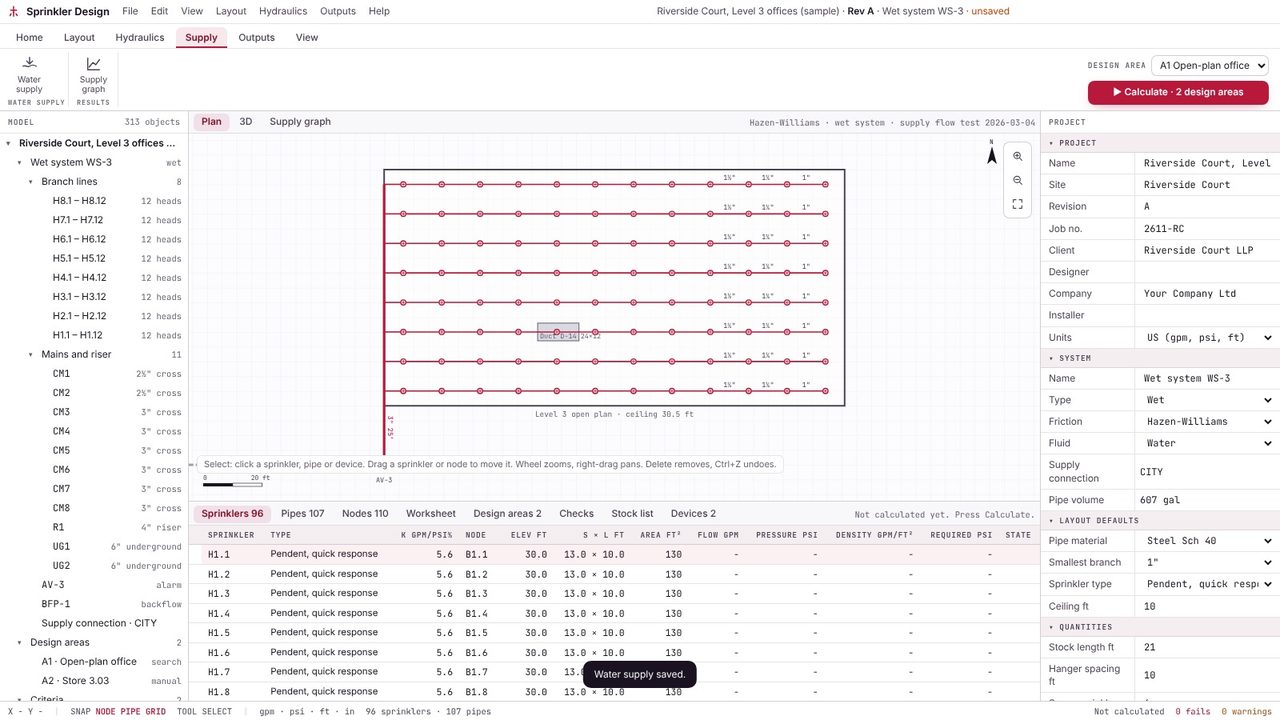
The Devices tab lists the alarm valve and backflow preventer between the connection and the riser, with the maker's loss points and the loss at the design flow. Edit a device in the properties to use your maker's data.
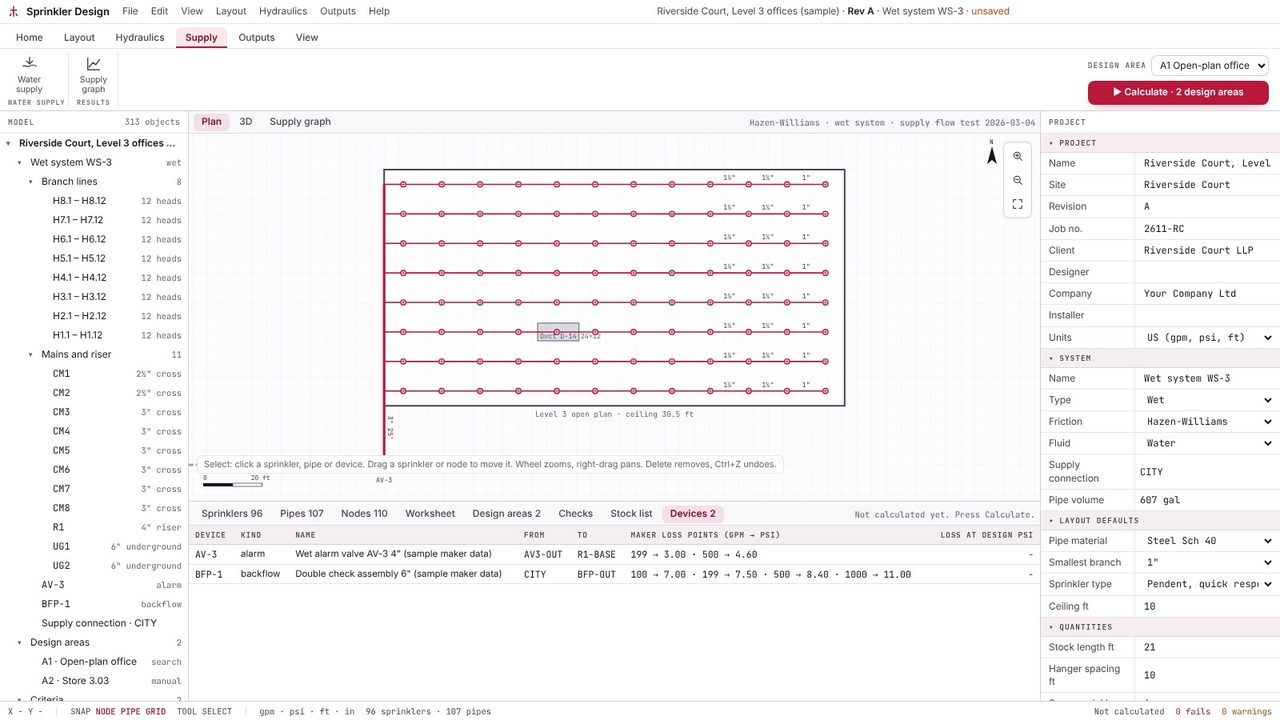
Click Calculate. The sprinkler demand is worked back to the supply connection through the riser, the devices and the underground, with the elevation.
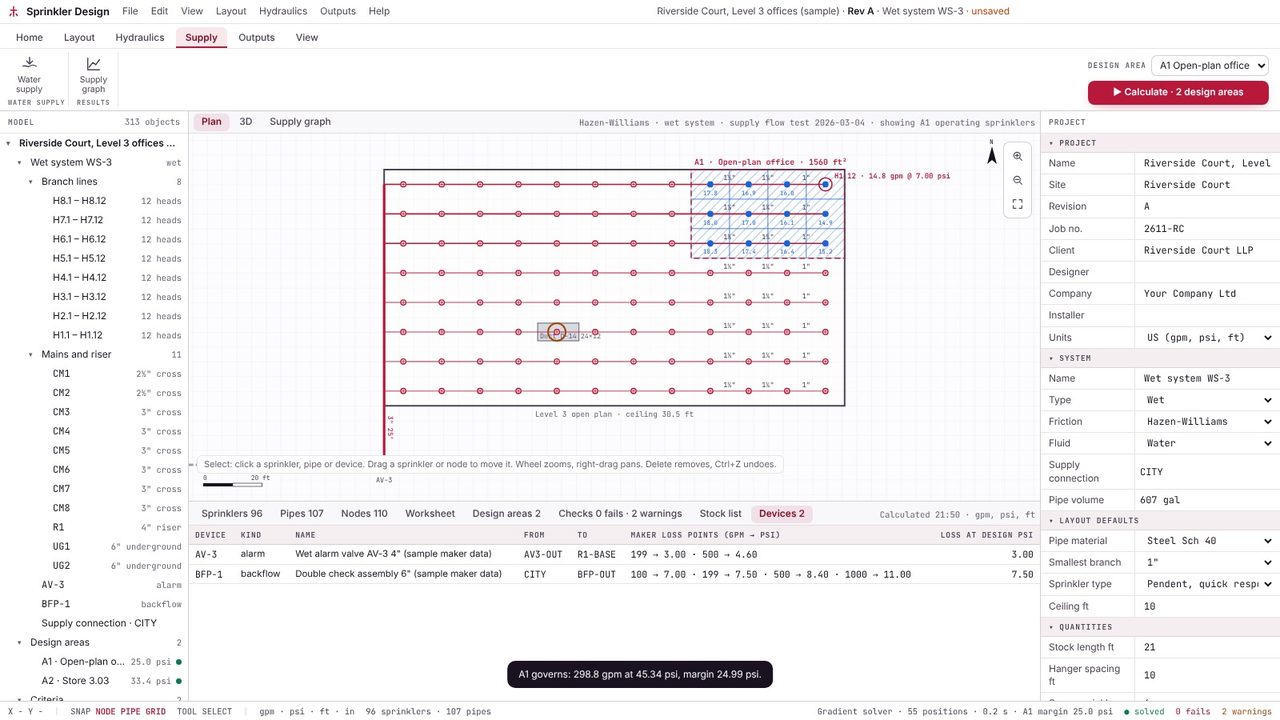
The Supply graph view plots the supply curve from the flow test against the demand on N^1.85 paper: the sprinkler demand, the hose allowance on top, and the total.
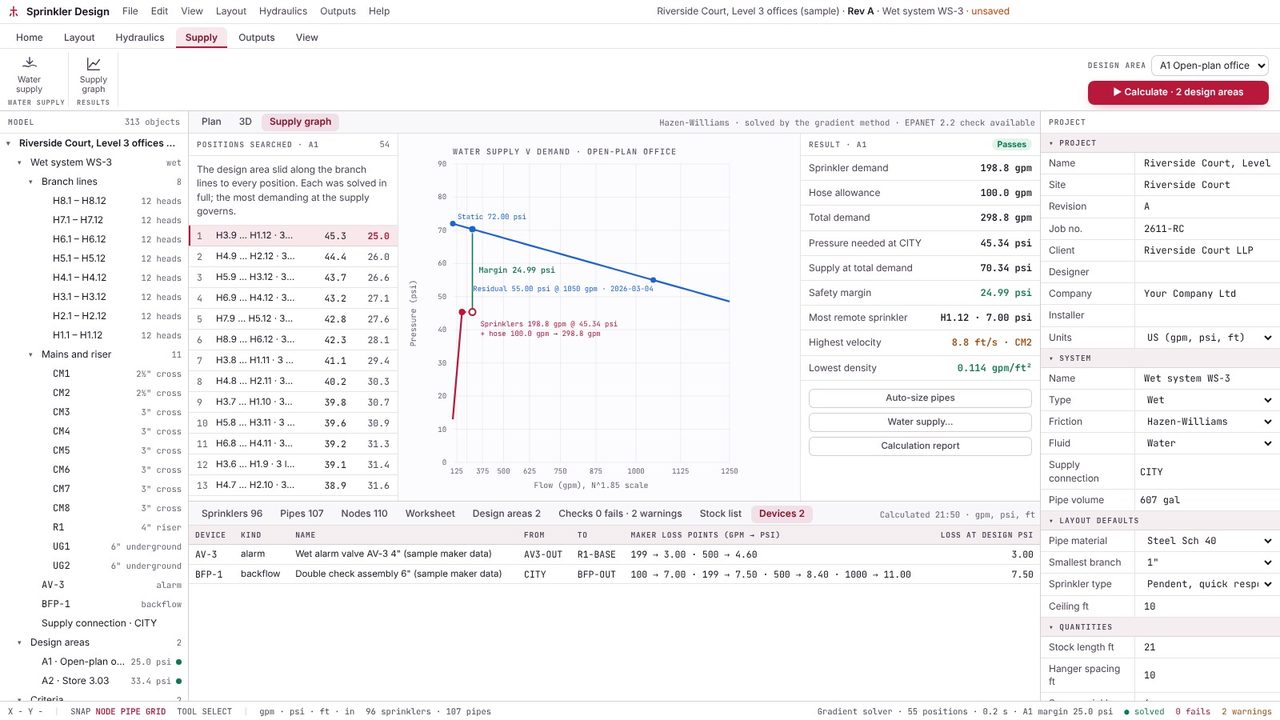
The gap between the supply and the total demand at the design flow is the safety margin. The result panel shows it beside the margin you asked for in your criteria, and the check fails if it's short.
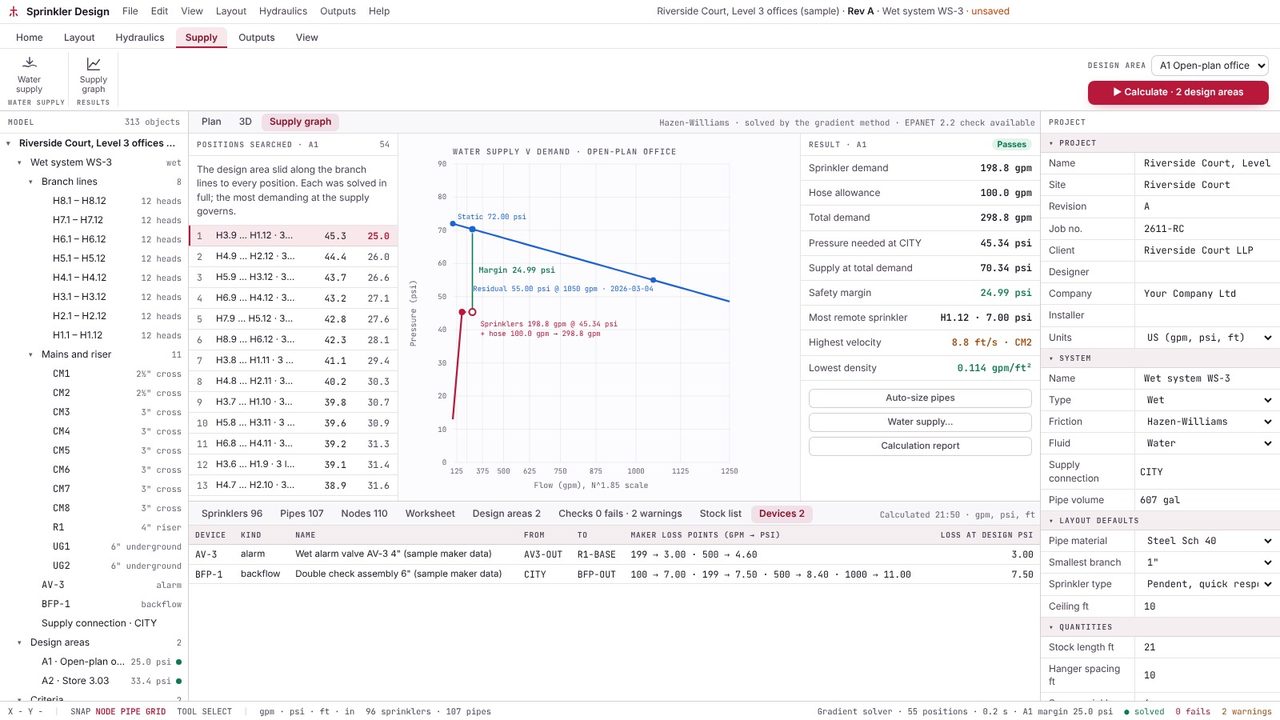
Graph paper whose flow axis is scaled to flow to the power 1.85, the exponent in the Hazen-Williams formula. Because a water main's pressure drop rises with about Q^1.85, the supply curve from a flow test plots as a straight line from the static pressure through the residual point.
From the flow test: P = Ps - (Ps - Pr) × (Q / Qr)1.85, where Ps is the static pressure, Pr the residual pressure and Qr the flow at the residual. The app does this at every flow and takes off the elevation and device losses.
It comes from the standard, specification or authority you work to, so you enter it with your criteria. The app checks the design against it but doesn't set one for you.
Yes. Switch the project to L/min, bar and metres and the flow test, graph and report follow.