How-to guide
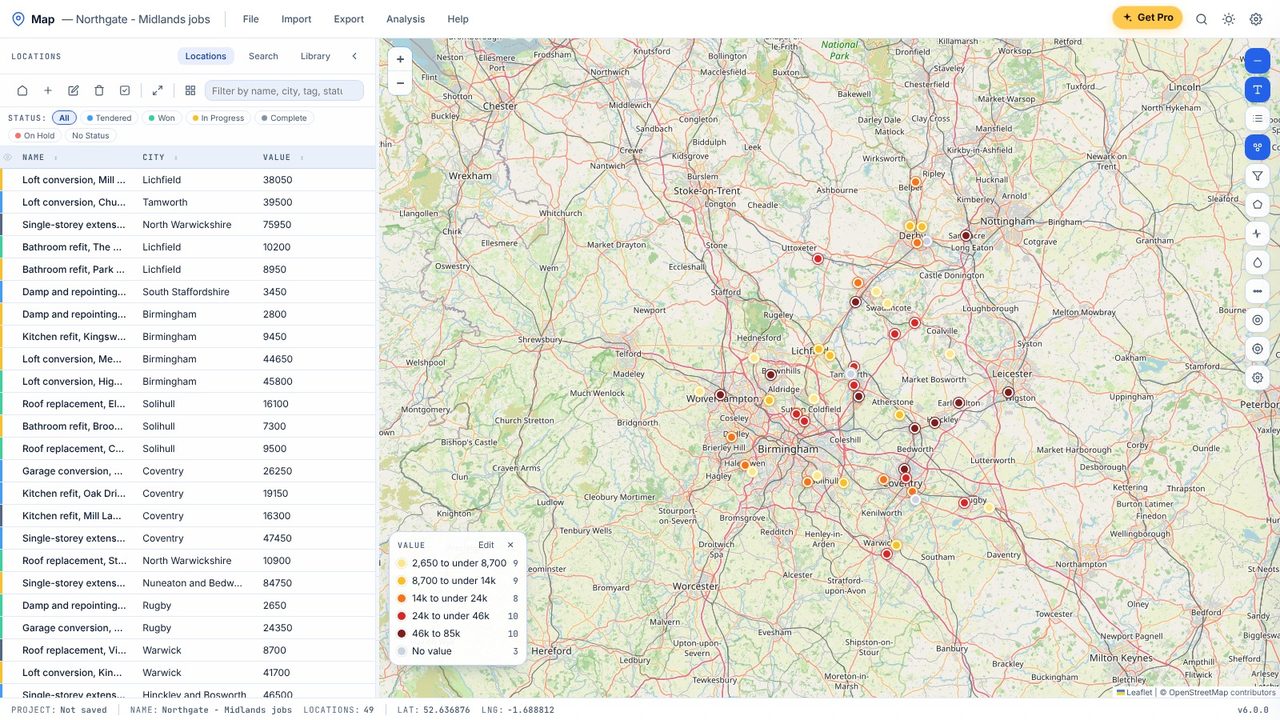
Give each status, tag or client its own colour - or show a number column such as value as five ranges - and Map adds a legend with the count for each.
Click the palette button on the map toolbar, press C, or choose Analysis → Colour by a column.
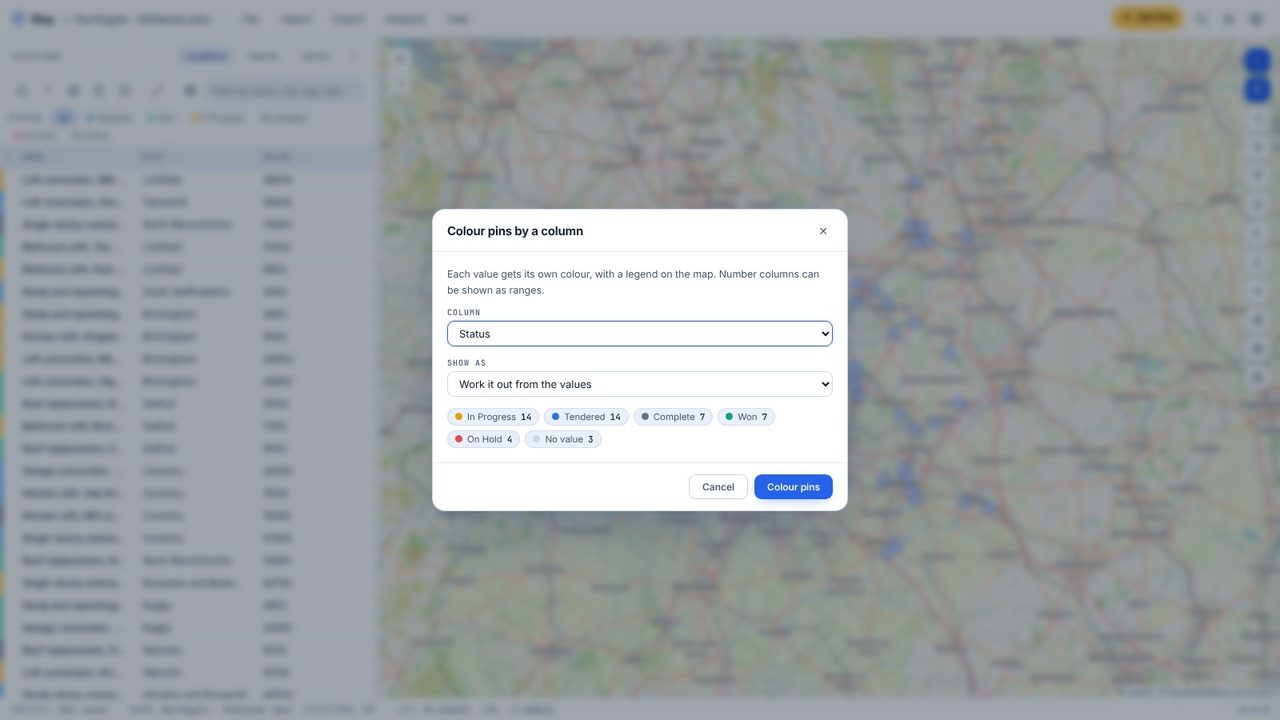
Choose Status, Group / tag, City, your third column or any of your own fields. The preview shows the colours and counts.
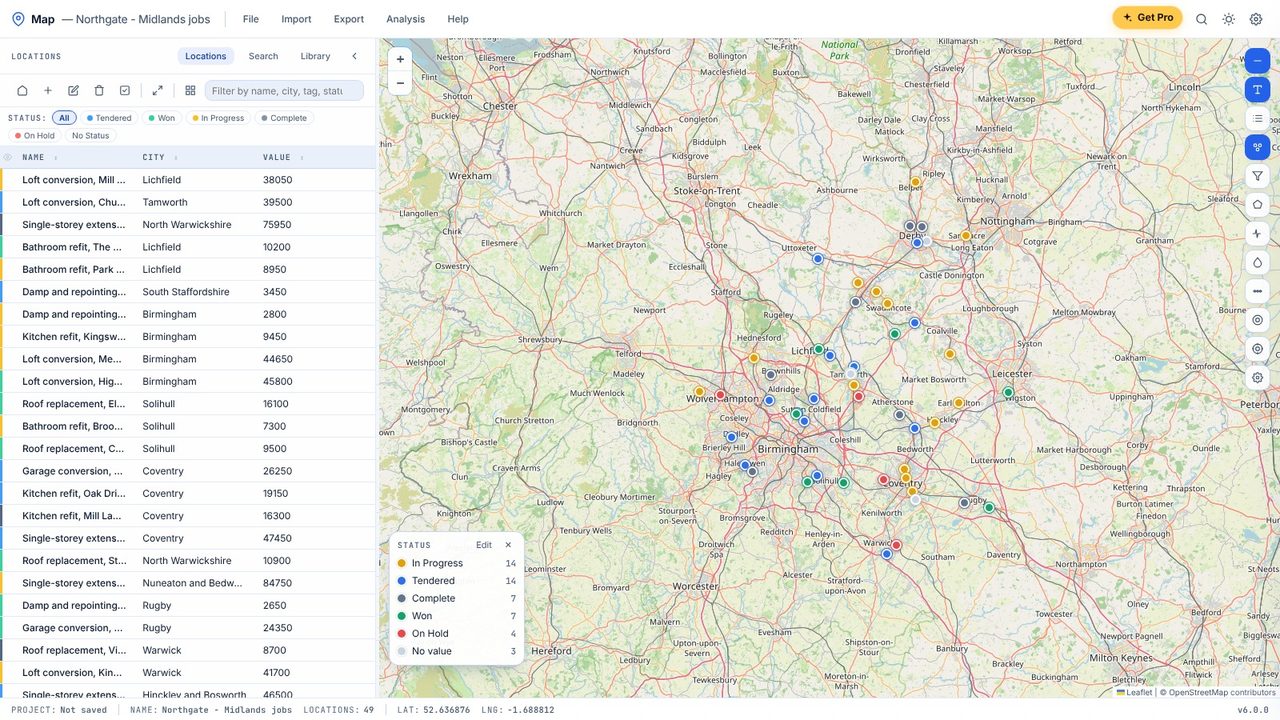
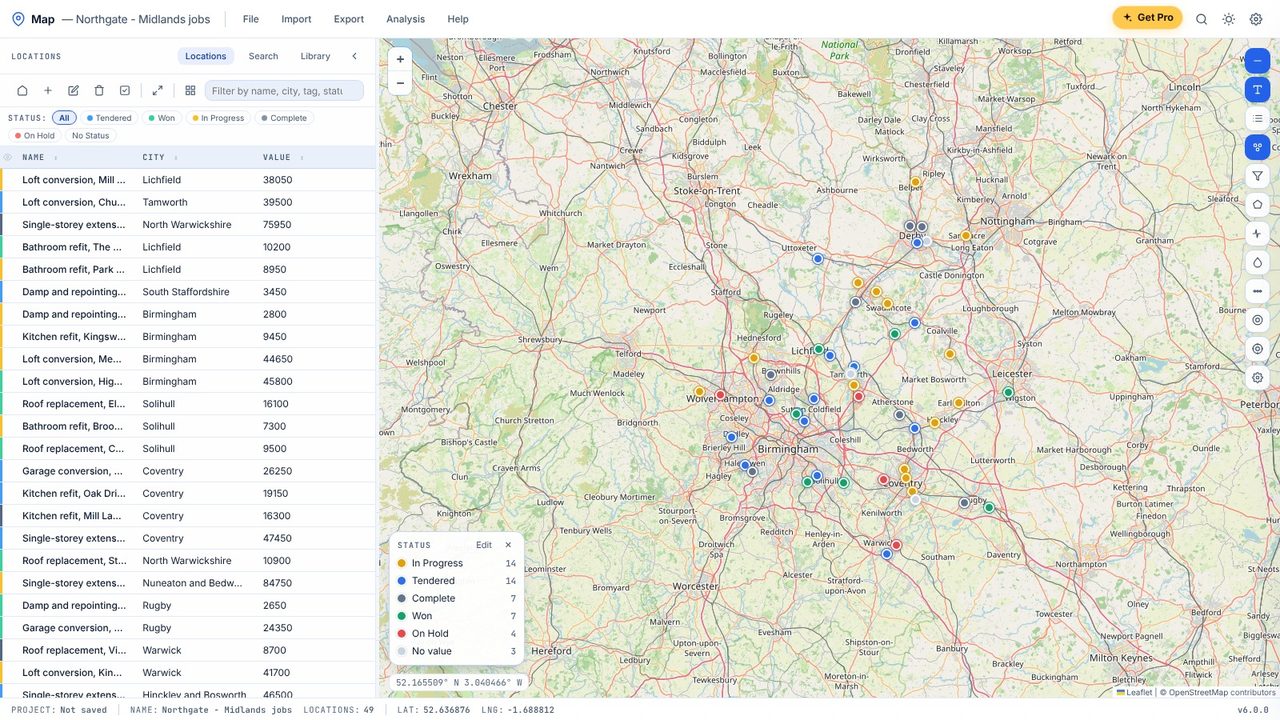
The legend in the corner lists each value with its colour and how many locations have it.
Pick a number column such as Value and Map shows it as five ranges, light to dark.
Yes. Colour by a column, the legend and poster maps are free in Map.
Yes - any custom field you add in Project Settings, and the postcode area or council area when your locations came from postcodes.